
Brand health metrics are the backbone of any modern marketing program that claims to influence revenue, lower customer acquisition cost (CAC), or defend pricing power. In 2025, brands that report only traffic, followers, or “engagement rate” are left scrambling to explain why awareness is up but growth has stalled. True brand health tracking means tying recall, sentiment, and reputation to financial outcomes—across paid, organic, and retail channels. This guide covers essential metrics, trusted formulas, practical benchmarks, and includes a scorecard model that maps each lever to commercial impact. For the strategic “why,” see how brand investment drives outcomes in Why Branding Still Drives Business Growth in 2025.

Work With Quimby Digital
Keep the brand, grow the numbers. Quimby builds brand health systems that lower CAC, lift conversion, and increase pricing power—without vanity metrics.
90-Day Plan: audit → scorecard + survey ops → SOV/SoS + sentiment tracking → dashboard + leadership reporting.
What you get: operator-grade scorecard, benchmarks, and an insights cadence finance actually buys.
Book your 30-minute brand health audit → https://qstaging2.uniqcli.com/contact/
What Is Brand Health?
Brand health signals your brand’s present and future ability to drive demand, defend pricing, and sustain loyalty—based on the blend of perception (how you’re known), reputation (how you’re remembered), and preference (why you’re chosen). Brand health tracking connects qualitative sentiment (reviews, social listening) and quantitative benchmarks (recall, NPS, share of voice) to business drivers like media efficiency, retention, and market share. Unlike vanity stats, strong brand health metrics predict whether paid, organic, and sales channels convert profitably—at scale. For related funnel context, see Navigating the Modern Marketing Funnel.
How to Build a Brand Health Scorecard
A solid brand health scorecard starts with one north-star business objective: e.g., support premium pricing, grow market share, or reduce CAC. Map metrics into inputs (diagnostic), outputs (impact), and set a quarterly reporting cadence. Draw survey samples from both active customers and market-representative prospects; segment by cohort when possible. Ownership lives with Brand/Insights but includes buy-in from Finance and Executive teams. Always align reporting to business priorities and refresh every quarter as strategy evolves.
Awareness Metrics (Prompted, Unprompted, and Consideration)
Unprompted brand recall measures the share of respondents who name your brand first, without cues. Prompted awareness records share after respondents see a brand list. Consideration is the percentage who’d consider buying when prompted.
Formula:
- Unprompted Recall (%) = (No. naming your brand first / Total respondents) × 100
- Prompted Awareness (%) = (No. selecting your brand from list / Total respondents) × 100
- Consideration (%) = (No. “would consider” / Total respondents) × 100
Benchmarks differ: mature CPGs target 60–90% prompted; startups/innovators see 10–30%. For hands-on tactics to lift top-of-funnel, explore Making Waves: Your Guide to Unforgettable Brand Awareness.
Reputation & Sentiment Metrics
Net Promoter Score (NPS):
NPS = (% “promoters” [9–10] – % “detractors” [0–6]). Segment results by audience and calibrate to category averages.
Sentiment Index:
Blend social listening, brand surveys, and review context. Use -100 to +100 scaling, adjusted for volume.
Review Velocity/Quality:
Track frequency and average score from platforms like GMB and retail sites. Weight recent reviews more heavily and monitor fraud/bot patterns.
Deep-dive the governance side in Reputation, Reimagined: Mastering Brand Management in the Digital Age.
Competitive Visibility Metrics: Share of Voice & Share of Search
Share of Voice (SOV):
% of total online “voice” your brand owns = (Paid + Earned + Social mentions for your brand) / (Total mentions for you + competitors) × 100. Analyze by media type; weight by relevance.
Share of Search (SoS):
SoS (%) = (Brand search queries / total category searches for your peer set). Google Trends/Keyword Planner helps compare peers.
For search analytics that connect to performance reporting, see Decoding Search Ads Analytics.
Consideration & Intent Metrics
Purchase Intent:
Percent of target audience selecting “very likely to purchase” (top-2-box) in survey; break out by audience/product line.
Site Intent Proxies:
Returning visitor %, content depth, and % of traffic reaching product/plan pages. Always segment by cohort to avoid misleading averages.
Equity & Preference Metrics
Brand Preference:
Share of audience selecting your brand as first choice or “most likely to buy next.”
Brand Uplift:
Delta in CTR/CVR between branded vs unbranded creative (A/B). Example: 2.2% vs 1.0% CTR → +120% uplift.
Brand Equity Index (composite):
Example weighting: 0.3 × Awareness + 0.2 × NPS + 0.2 × SOV + 0.1 × Preference + 0.2 × Intent (recalibrate by maturity/vertical).
Distribution & Community Reach
Track share rate, save rate, and UGC ratio:
- Share Rate = shares / impressions
- Save Rate = saves / impressions
- UGC Ratio = UGC pieces referencing brand / total brand mentions
If retail is a channel, add retailer search/browse share inside marketplaces to your model.
From Metrics to Money: Linking Brand Health to ROI
Each metric connects directly to commercial levers:
| Metric | Channel Lever | Commercial Impact |
| SOV/SoS/Recall | Paid + PR | Future market share (forecasting demand) |
| NPS/Sentiment | Referral + pricing | Lower CAC, higher LTV, margin defense |
| Consideration | Funnel targeting | Win rate, offer/promo control |
| Equity/Preference | Organic + pricing | Revenue per customer, pricing power |
| Advocacy/UGC | Organic + paid social | Content flywheel, low-CAC incremental reach |
Improving SOV, SoS, or reputation typically lifts both digital and offline ROI—showing up as better media efficiency and higher contribution margin. For brand-led growth playbooks, see Your Guide to Brand Awareness and Loyalty.
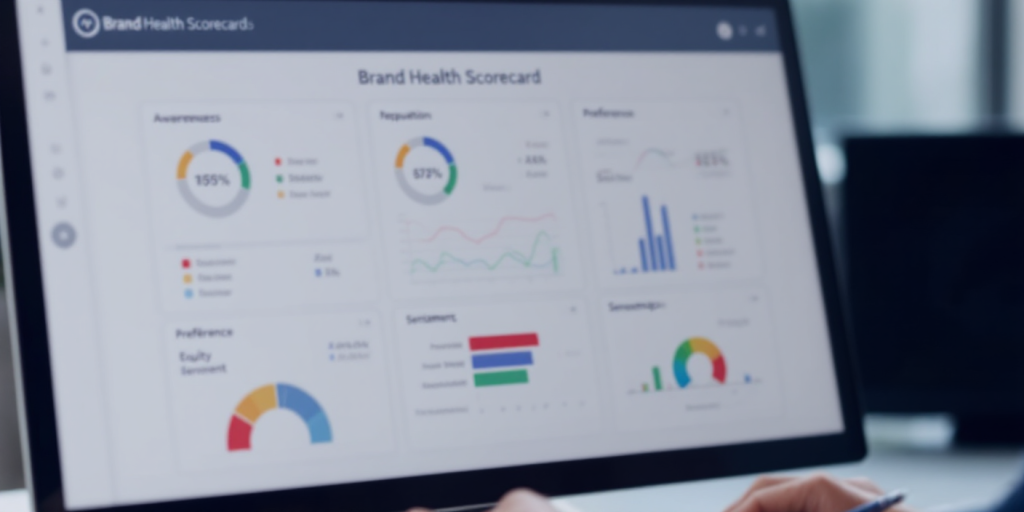
Dashboard & Reporting: What Good Looks Like
An effective brand health dashboard blends surveys, GA4, SEO/share-of-search tools, social listening (Brandwatch, Sprout, Meltwater), and review aggregators (G2, Trustpilot). Use monthly or quarterly cadence. Present executives with a scorecard view, RAG heatmaps, and segment filters. Define trigger thresholds (e.g., 10% dip in SOV, NPS, or review velocity) that prompt investigation and corrective action.
FAQs (Brand Health Metrics)
What are the most important brand health metrics for early-stage brands?
Start with unprompted recall, consideration, SOV, basic sentiment, and UGC/community growth. Layer equity/preference as you scale.
How often should a brand run a brand health survey?
Quarterly for dynamic categories; bi-annual or annual for slower industries. Track social and review signals monthly.
What sample sizes are credible?
Consumer: ~250–400 per market/cohort. Niche B2B can be smaller but must be representative (avoid loyalist bias).
Which tools can automate social listening and SOV?
Sprout Social, Brandwatch, Meltwater for sentiment/SOV; NewsWhip or Talkwalker for trend detection.
How do we set targets without competitor transparency?
Blend public market data (e.g., Trends) with your historicals and category norms; iterate targets quarterly.
How do we tie brand health improvements to CAC/LTV?
Use test/control or time-series analysis; map program changes to shifts in SOV/sentiment, then observe CAC/LTV movement in dashboards.
Work With Quimby Digital
Keep the brand, grow the numbers. Quimby builds brand health systems that lower CAC, lift conversion, and increase pricing power—without vanity metrics.
90-Day Plan: audit → scorecard + survey ops → SOV/SoS + sentiment tracking → dashboard + leadership reporting.
Book your 30-minute brand health audit → Contact Quimby Digital